01.
SaaS Dashboards & Data
Analytics dashboards, admin panels, and interactive reports that turn complex data into decisions — real-time updates, role-based access, scalable architecture.
AngularReactTypeScriptCharts
Discuss a project Front-enddeveloperbuildingSaaSdashboards,businesstools,anddata-driveninterfacesthathelpcompaniesmakebetterdecisions.
I'm a front-end developer with 6+ years of experience building dashboards, admin panels, and data-driven applications. I specialize in Angular, React, and the broader TypeScript ecosystem.
I turn complex business data into clean, performant interfaces — from inventory management to SaaS analytics. I focus on building tools that solve real problems and deliver measurable results.
1export function Dashboard() {2 const m = useMetrics(range)34 return (5 <Grid columns={3}>6 <StatCard label="Revenue" value={m.revenue} />7 <Chart series={m.series} live />8 </Grid>9 )10}
Analytics & admin panels
Analytics dashboards and admin panels built with Angular, React, and TypeScript. Real-time data, role-based access, and scalable architecture.
Replace the spreadsheets
Internal tools, cost-management systems, and workflow apps that replace spreadsheets and manual processes.
Data you can act on
Charts, graphs, and interactive reports that turn complex data into actionable insights. Real-time updates via WebSocket and SSE.
One codebase, every screen
Cross-platform products with React, React Native, and Electron — from desktop apps to installable PWAs and mobile experiences.
Automate the workflow
Custom VS Code extensions that automate dev workflows — context gathering with ts-morph, off-thread analysis, and generated, ready-to-use LLM prompts.
Measurably faster apps
Tuning Angular apps for speed — bundle and lazy-loading strategy, change-detection optimization, and Core Web Vitals improvements.
Analytics dashboards, admin panels, and interactive reports that turn complex data into decisions — real-time updates, role-based access, scalable architecture.

Cross-platform products from desktop tools to installable PWAs and native-feeling mobile experiences — one codebase, every screen.

AI-powered features and custom developer tools that automate workflows — VS Code extensions, code analysis, and generated, ready-to-use LLM prompts.
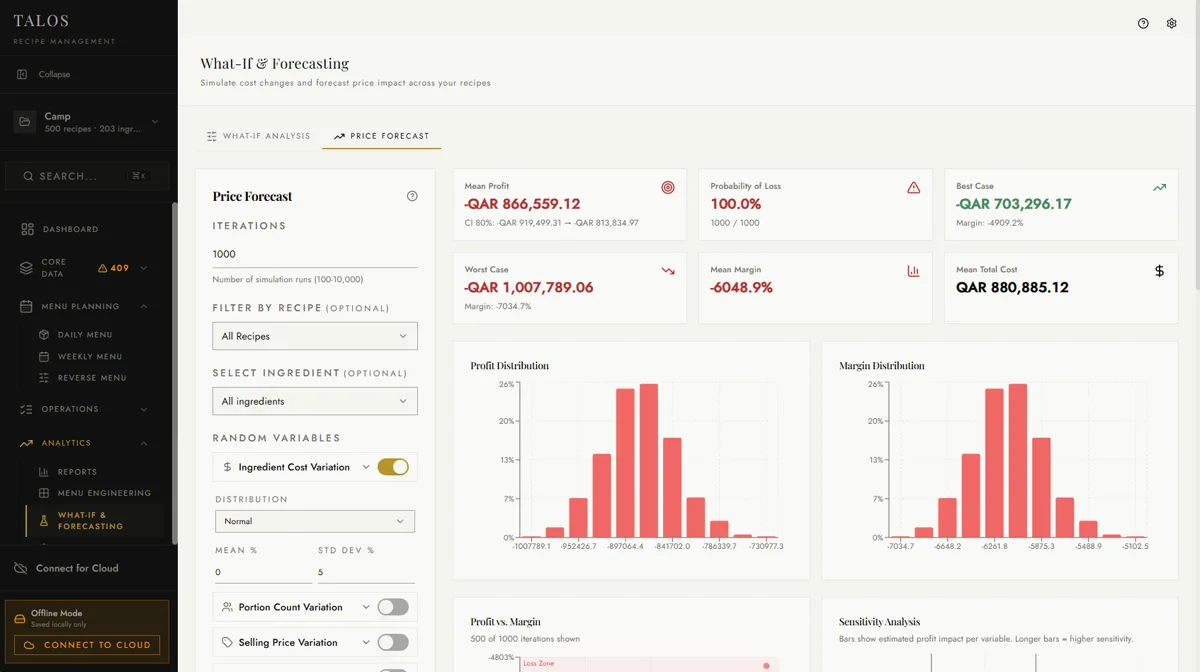
Restaurant owners were costing every dish in Excel and still guessing their margins. This desktop app prices each dish, keeps warehouse stock in sync with every recipe, and flags the menu items that lose money.
Shipped and in daily use — hours of spreadsheet food-costing become minutes.
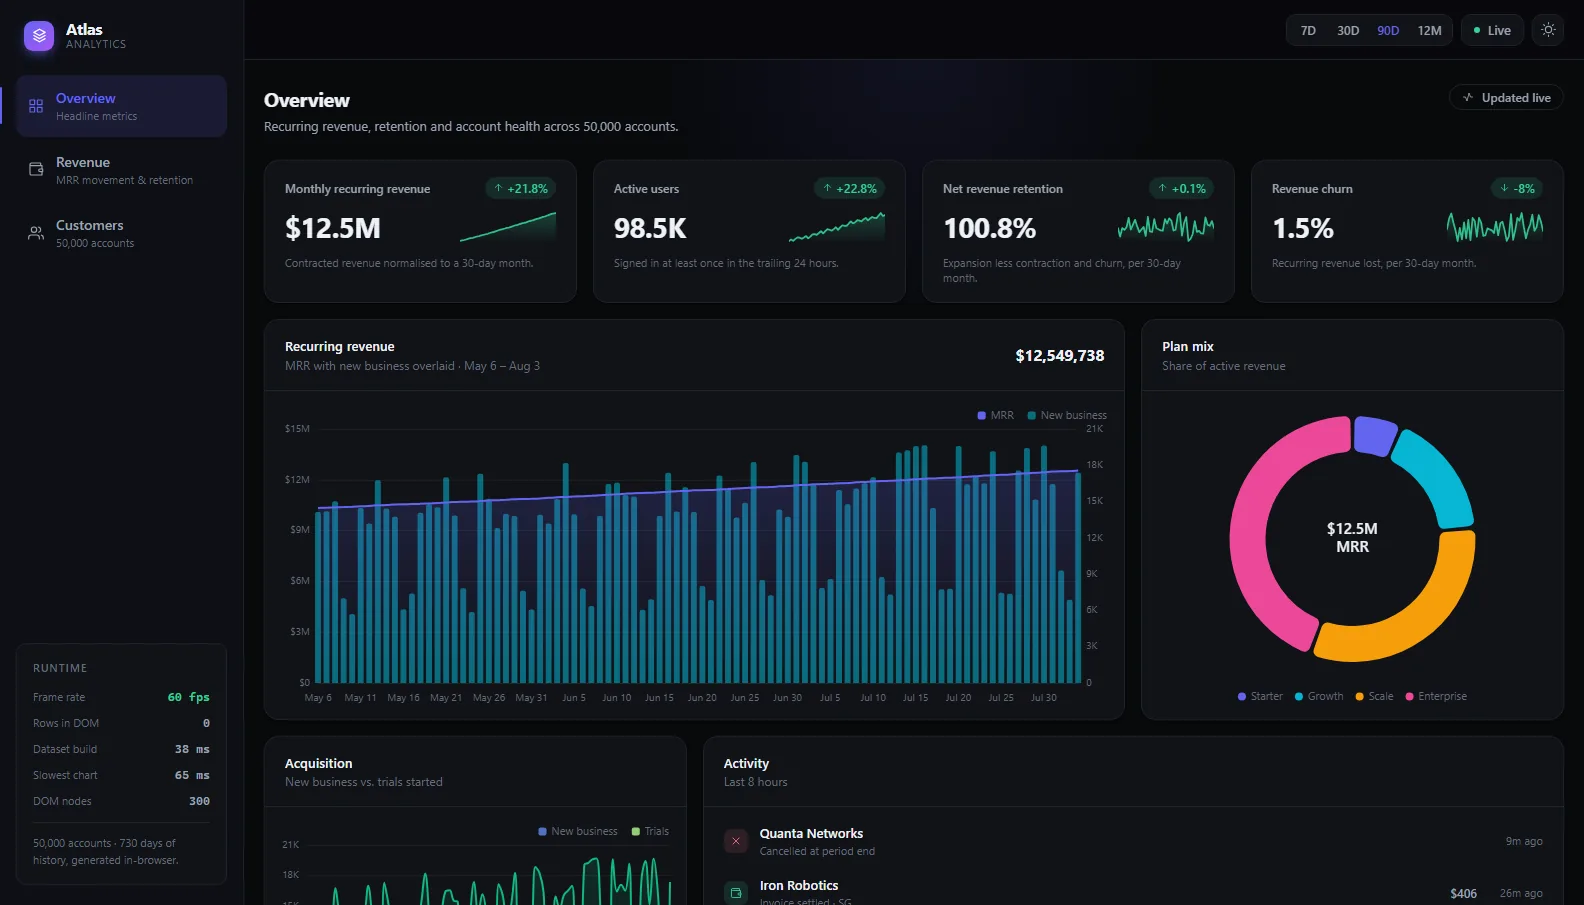
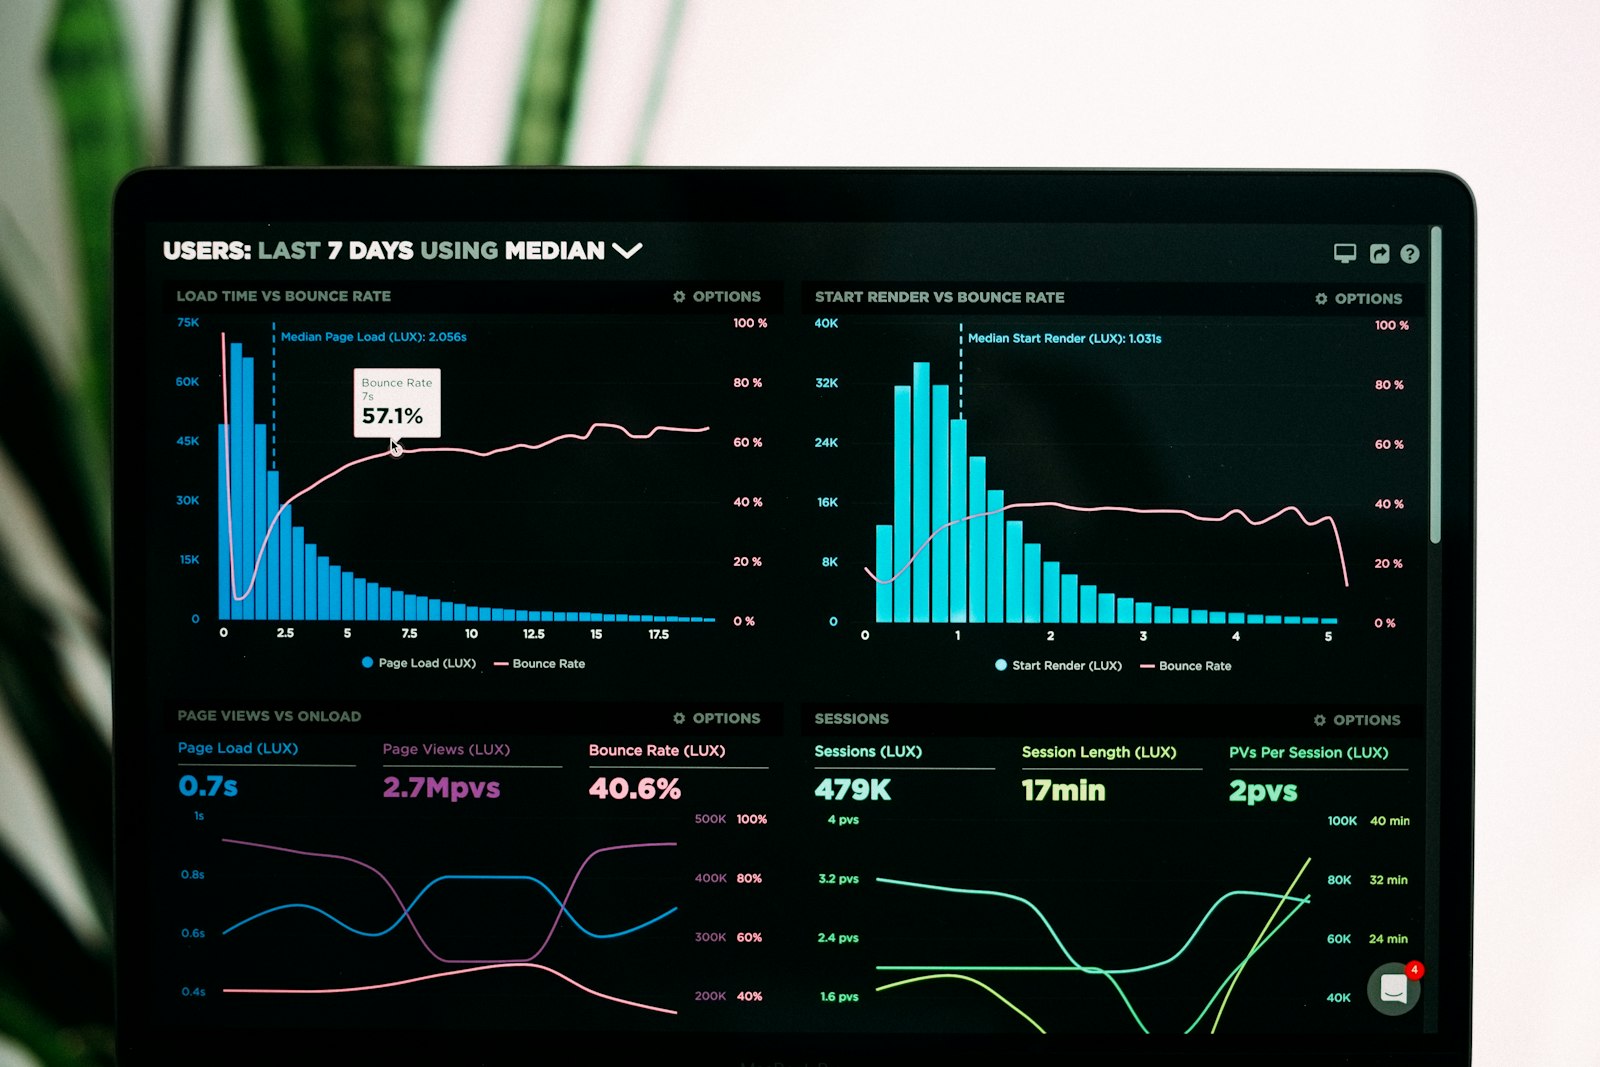
Admin dashboards get slow as the data grows. This one holds 50,000 customer accounts and two years of revenue history, and every filter and sort answers in under 15 ms. Ask it why revenue moved and a Gemini-backed assistant replies from the numbers on screen — then switches the time window itself to show you.
Speed you can check yourself: frame rate and filter cost are measured live in the app. The assistant is held to the same standard — it answers only from the data on screen and says so when a figure is not there.
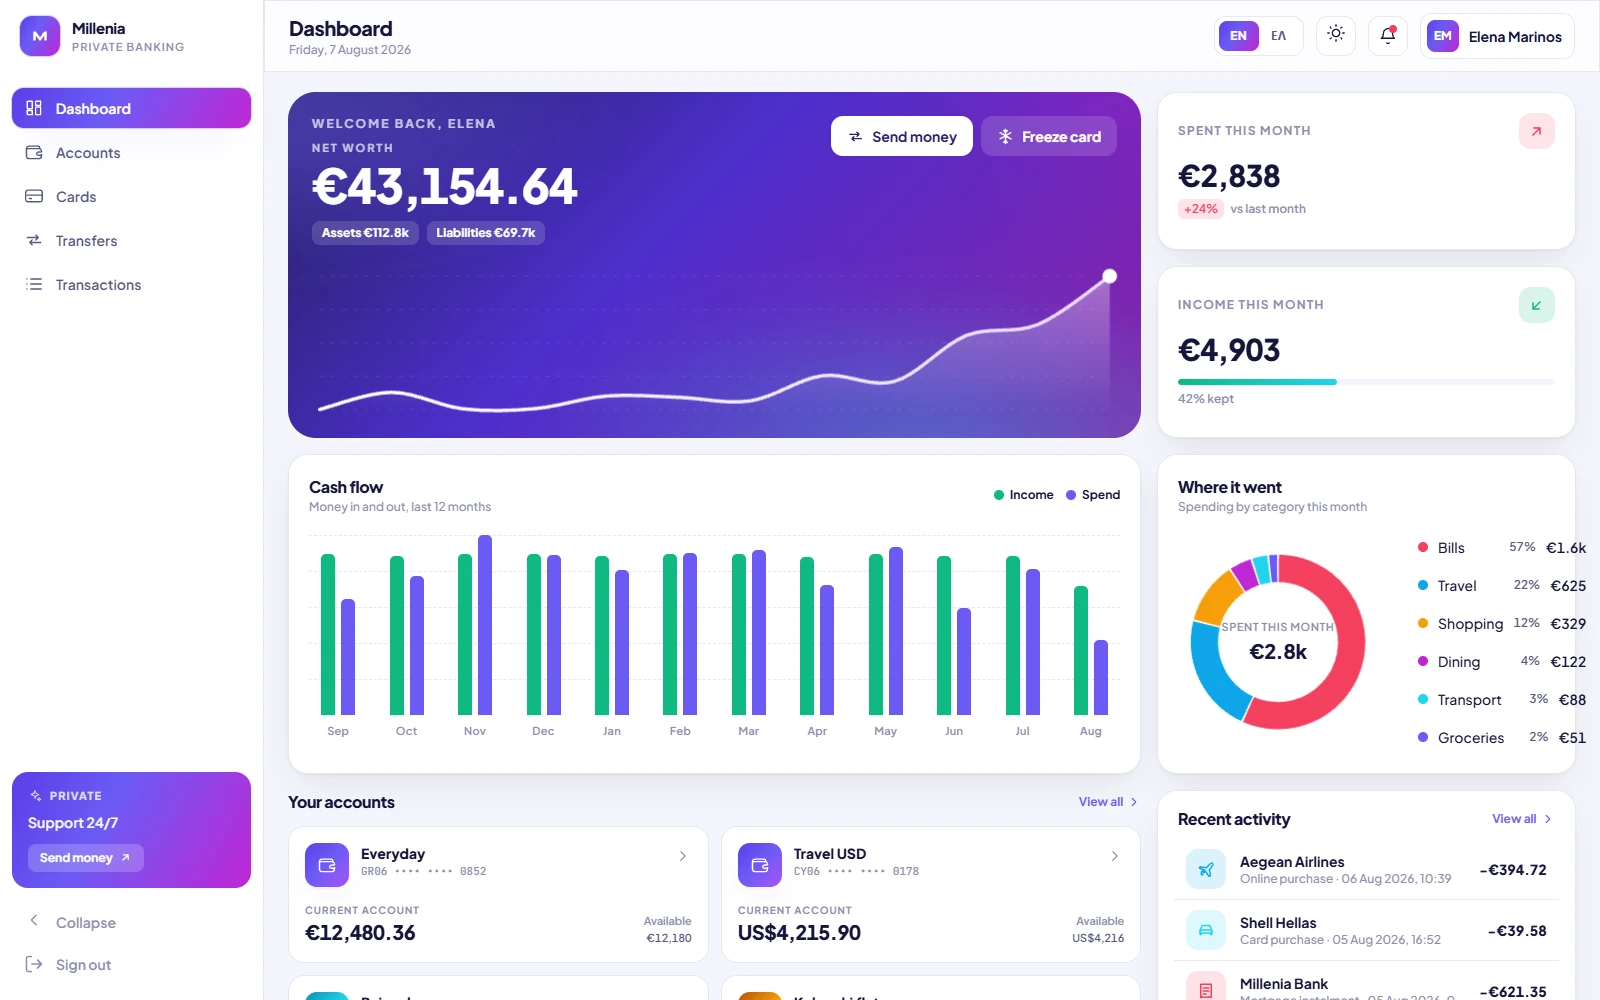
A complete online banking interface: accounts, cards, a guided three-step transfer with real IBAN validation, and a searchable statement you can export to CSV. Light and dark, English and Greek.
Rebuilt from a 2022 version down to an 84 kB first load — no UI library, every chart drawn by hand.
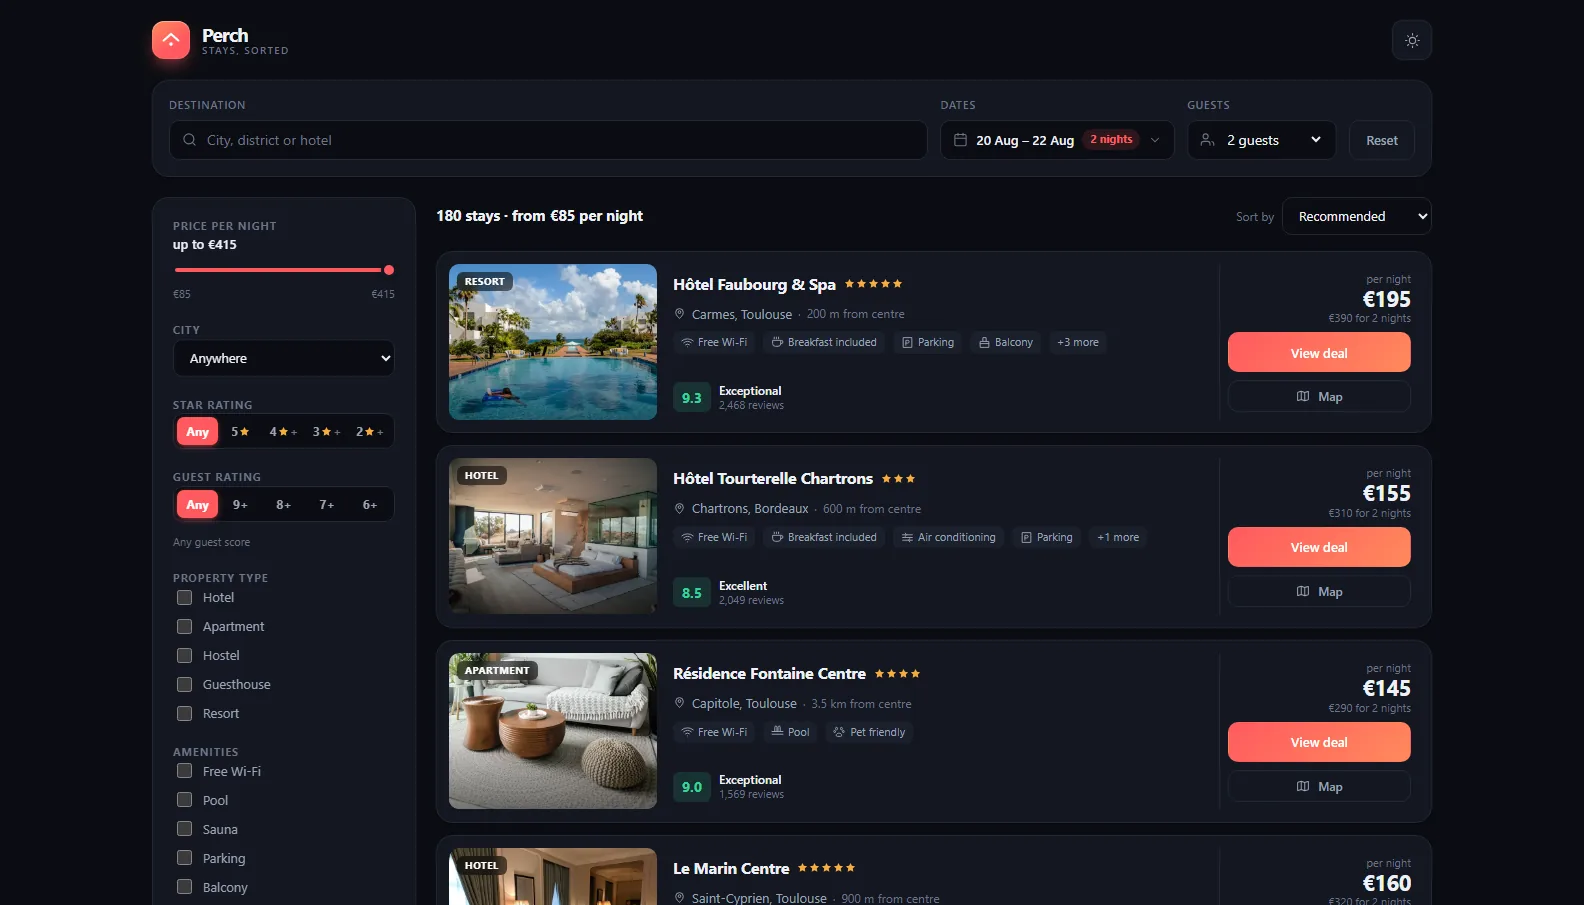
Hotel search that opens in about a second, even on a phone on mobile data. 180 properties, a two-month date picker, a live map, and every filter saved into the link so a guest can share exactly what they found.
17 kB on first load, roughly a twentieth of a typical React site, with the map downloaded only when someone opens it.
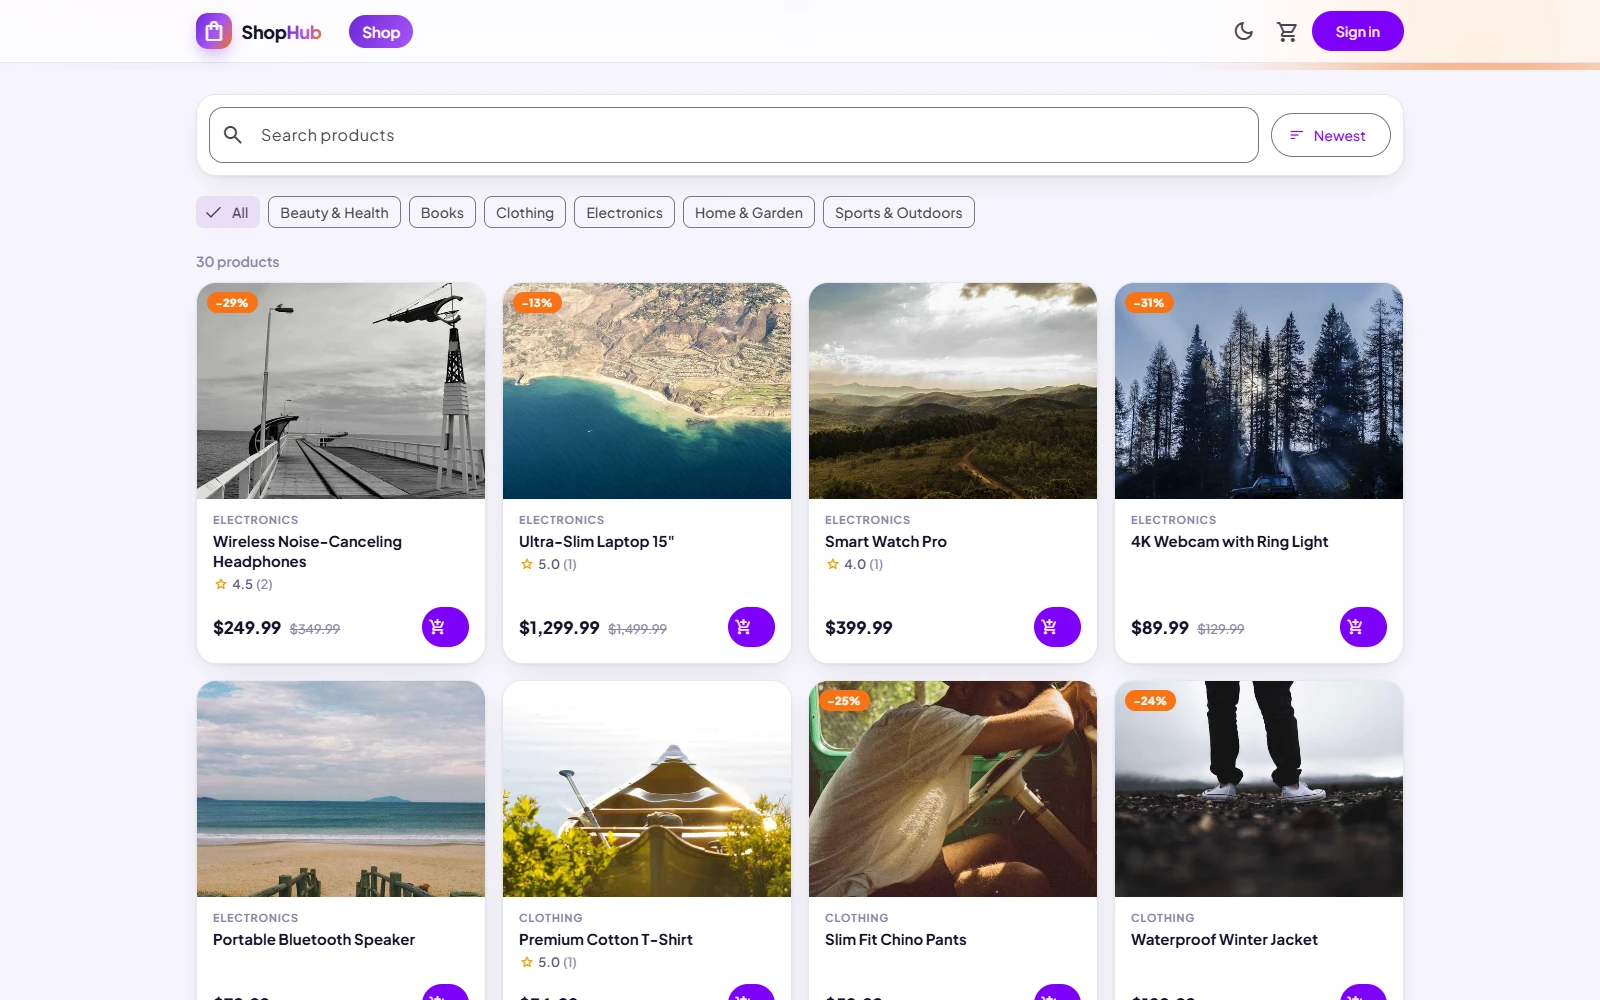
A shop and its back office in one build: customers browse, review and check out, while the owner runs catalogue, stock, orders and discount codes from the same admin.
Angular front end on a real Express/SQLite API with JWT auth — the operator half of e-commerce that most demos skip.
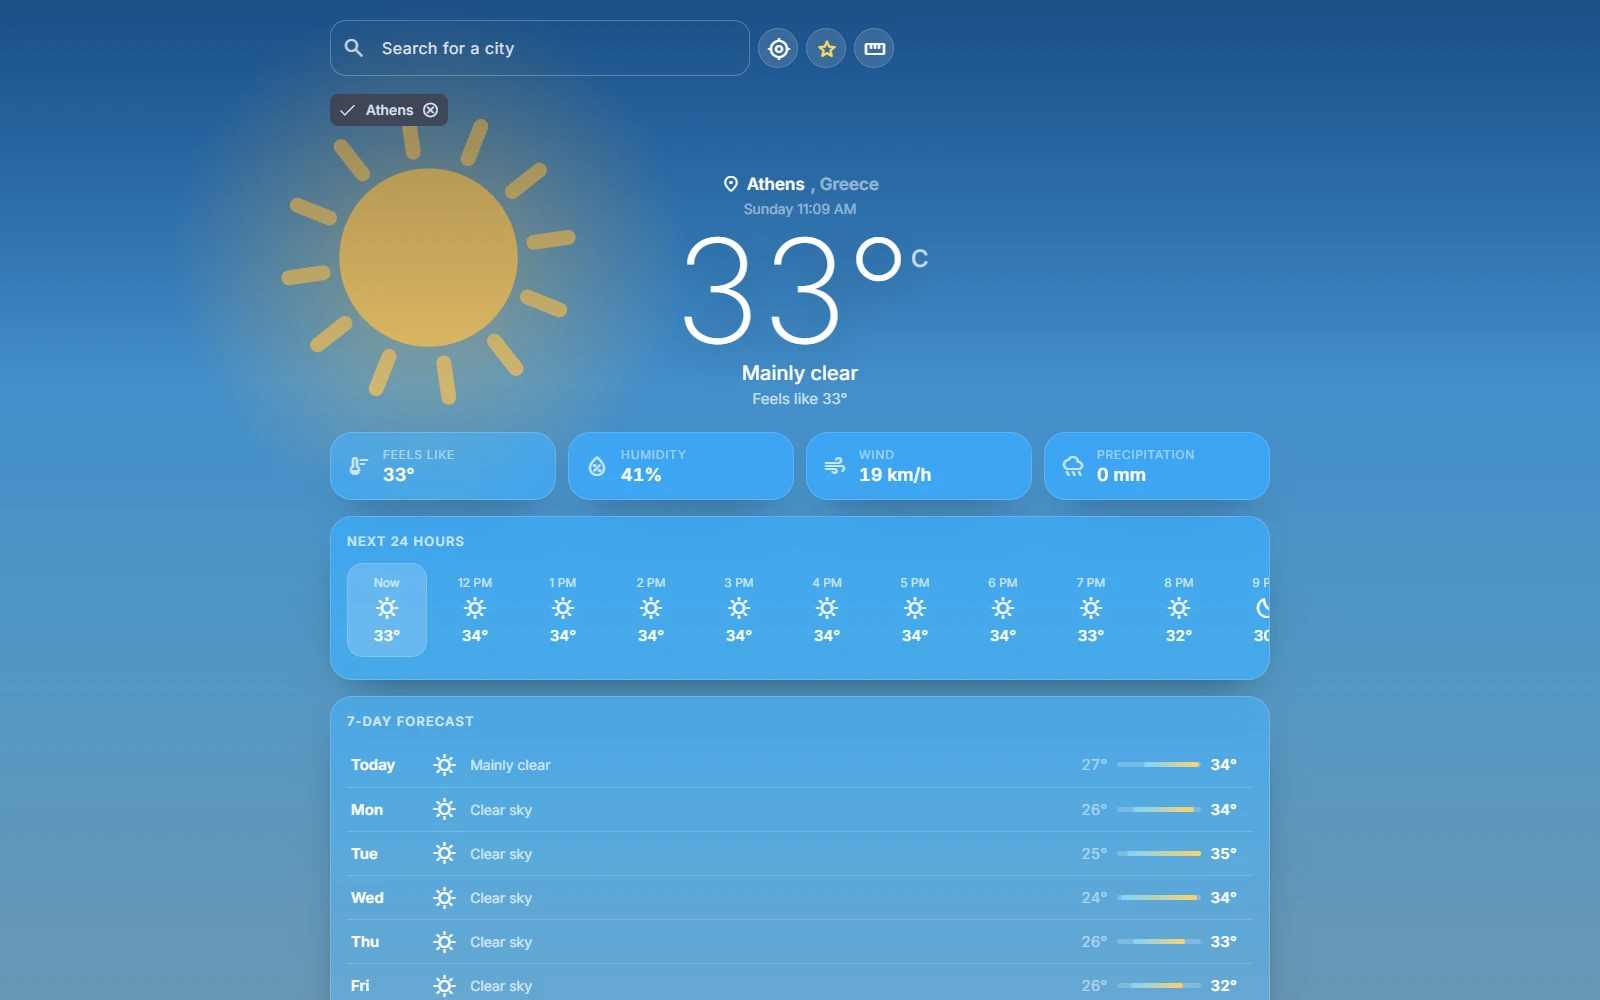
Weather answered in one glance — live conditions and a 7-day forecast for any city, installable to a phone home screen like a real app and still readable with no connection.
The sky behind the numbers is drawn in SVG and animated with GSAP: sun, clouds, rain, snow and lightning all react to the actual forecast.
Have a dashboard, internal tool, or data-heavy product in mind? I'd love to hear about it. Drop a message and I'll get back to you.
[email protected]This site uses cookies for anonymous analytics to understand traffic. You can opt out.